Oil Workers Say Their Pay Was Stolen Before the Bust
March 15, 2016The Shale Reckoning Comes to Oklahoma
March 21, 2016An important paper by the Southwest Pennsylvania Environmental Health Project
Summary on Compressor Stations and Health Impacts
February 24, 2015
Compressor station emissions fall into two categories: construction emissions and operational emissions. Within operational emissions there are three types that warrant individual attention – blowdowns, fugitives and accidents. This document provides perspective on the aptness of the method of estimation (in tons per year) and need for further detail about the VOC and PM estimated emissions to better consider health risk.
Compressor construction and operational phases are generally projected to produce emissions below the NAAQS standards. They are presented in tons per year. This measure of emissions is used for NAAQS purposes which determines the air quality designation over a region and over long periods of time. The problem posed by estimating tons of contaminants emitted per year is that over the course of a year emissions will vary, often greatly. As phases of construction and operation change so will emissions content and concentrations. For a resident living near a compressor station, the concern is not simply PM2.5 emissions over the course of a year, but is PM2.5 emissions during the peak construction time when it’s at its most intense.
Even during normal operations compressor stations have been shown not to emit uniformly (“blowdown” and accident events will be discussed separately).1 The measurement tons per year, while common in the industry and common in the environmental field where regional air quality is at issue, is not an appropriate measure to determine individuals’ health risks which increase during episodes of high exposures.
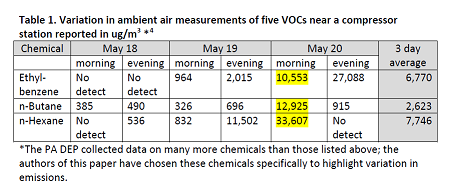
Table 1 shows the day to day and morning to evening variability in emissions at one compressor station near Hickory, Pennsylvania. It comes from a Pennsylvania Department of Environmental Protection. We present this case to show documentation of fluctuations not captured by averages.2 Note how much relevant emissions information is lost when relying on averages, even of just three days. When extending this logic across a year, there is little doubt that there will be times of high levels of contaminants released and these high levels can increase health risks to residents. It is also notable that the EPA inhalation reference concentration (RfC) for ethylbenzene is 1 mg/m3 (equivalent to 1,000 ug/m3).3 Some of the reported emissions exceed this standard of health safety.
Download the full paper as a pdf.
VOC = Volatile Organic Compound
PM = Particulate Matter
NAAQS = National Ambient Air Quality Standards (EPA)